INCOME INEQUALITY,
POVERTY, AND DISCRIMINATION
The statistical information, analytical concepts, and discussions of public policy alternatives discussed in this chapter can help students find their way through the maze of controversial topics and issues concerning income distribution and poverty.
The chapter begins by surveying some basic facts concerning the distribution of income in Canada. Then, the major causes of income inequality are considered. Third, the authors examine the debate over income inequality and the trade-off between equality and efficiency implied by this debate. Fourth, the poverty problem in America is analyzed. Finally, existing and alternative approaches to income security programs are outlined and discussed.
A brief discussion of the Gini ratio has been added to the presentation of the Lorenz curve.
A “Consider This” box on gender discrimination appeared as The Last Word in Chapter 15 of the previous edition.
After completing this chapter, students should be able to understand:
Much of the material in this chapter is descriptive and not difficult for students to comprehend. The difficulty comes in trying to separate emotional views of poverty and welfare programs from the facts. Good debate topics are found in this chapter, and both provincial and federal social assistance reform proposals can be presented for evaluation. Remind students that government “welfare” in the form of tax benefits and subsidies exists for middle-income and upper-income groups (education subsidies, farm subsidy programs, and others).
This can be an emotional issue for a variety of reasons. Some students may hold strong beliefs that have little basis in fact. There may be students in your class who are desperately struggling to escape from poverty. There may be some current or former welfare recipients in your class who do not wish to reveal this to others. Discussion on this topic leads through a minefield with loaded cannon perched on each side.
I. Income inequality facts
A. In 2000 about 3.3 million Canadian—10.9 percent of the population—lived in poverty.
B. Personal income distribution is shown in Tables 16‑1 and 16‑2.
1. Average family income in 2000 was $61,634.
2. 6.2 of the families had annual incomes of less than $10,000 annual income while 35.1 percent had annual incomes of $60,000 or more.
3. The top 20 percent of the families received nearly half (45.6 percent) of all income, almost than ten times as much as the lowest 20 percent of families.
C. The Lorenz curve depicts income distribution graphically. Figure 16.1.
1. If income were distributed perfectly equally, the Lorenz curve would be the straight‑line diagonal line.
2. The extent to which the actual income distribution varies from the line of perfect equality is the measure of inequality; the greater the distance of the curve from the line of equality, the more unequal the distribution of income.
3. The extreme would be a line that follows the horizontal axis to the right until it meets the right vertical axis and then turns upward along that axis.
4. The Lorenz curve can be used to compare changes in the curve over time or to compare income distributions across countries.
D. The Gini ratio measures the distribution numerically.
1. The Gini ratio is measured as the ratio of the area between the Lorenz curve and diagonal to the total area below the diagonal.
2. Higher numbers signify greater income inequality; lower numbers imply a more equal distribution. The Gini ratio is bounded between zero and one.
3. The Gini ratio for Canada in 2000 for lone-parent family was 0.498, but it was higher for elderly males (0.685) and lower for non-elderly white females(0.512).
4. Wealthier, more industrialized nations tend to have lower Gini ratios, while poorer, less developed nations have higher ratios.
E. Income Mobility: The Time Dimension
1. The income accounting period of a year is too short to be meaningful in judging income inequality. Over a period of time—several years, a decade, or a lifetime—earnings might be more equal.
2. If Brad earns $1,000 in year 1 and $100,000 in year 2, while Jenny earns $100,000 in year 1 and $1000 in year 2, income distribution looks unequal in a single year, but appears equal over the two‑year period.
3. There is considerable “churning around” in the distribution of income over time.
4. Most income receivers start at a low level, peak during middle age, and then decline. As a result, considerable income inequality will exist in any specific year because of age differences.
5. Individuals and families will move up to higher quintile groups or move down to lower quintile groups. This is called income mobility.
F. Effect of Government on Redistribution
1. The income date in Tables 16‑1 and 16‑2 show before‑tax, cash income, including earnings (wages, salaries, dividends, interest) and cash transfers (social security, unemployment compensation, welfare payments).
2. The figures do not take into account outlays for personal income taxes and payroll (social security) taxes.
3. Government significantly redistributes income from higher to lower income households through taxes and transfers.
a. Without government redistribution, the lowest 20 percent of households would have received only 4.1 percent of total income. With distribution they receive 5.0 percent.
b. Because the Canadian tax system is only modestly progressive, transfer payments are the most important method of redistribution. They account for more than 75 percent of the income of the lowest quintile.
II. Income Inequality: Causes
A. Ability differences lead to differences in earnings.
B. Education and training correlate closely with differences in earnings. In general, the more education, the higher the income.
C. Discrimination in education, hiring, training, and promotions contributes to income inequality.
1. If women and minorities are restricted to certain occupations, there will be an oversupply of workers relative to demand and wages and incomes will be low.
2. If women and minorities are restricted from entering white-male occupations, there will be an undersupply of workers relative to demand and wages and incomes will be high.
D. Differences in tastes and risk preferences lead to different incomes.
1. Workers who are willing to work long hours at arduous jobs will tend to earn more.
2. Those who are willing to assume risk, e.g., entrepreneurs, are likely to earn more income.
E. Unequal distribution of wealth:
1. Wealth is a “stock,” reflecting at a particular moment the financial and real assets an individual has accumulated over time. A retired person may have little income but vast amounts of accumulated wealth.
2. Ownership of wealth in Canada is more unequal than the distribution of income
3. This inequality of wealth leads to inequality in rent, interest and dividends, which contributes to income inequality.
F. Market power in the product market can lead to a firm receiving monopoly profits. A union or professional organization may be able to restrict the supply of labour, thus leading to higher than competitive wages and incomes.
G. Luck, connections, and misfortune are other forces explaining income differences. (Key Question 4)
III. Trends in inequality.
A. Absolute incomes have risen over time, while the relative distribution by quintile has been more or less unchanged since 1945.
B. Causes of growing inequality.
1. Firms have increased their demand for highly skilled and well-educated workers. Because the demand for these workers continues to exceed the supply, wages have been bid up. Between 1980 and 2000, the wage difference between college and university graduates and high school graduates increased. The growth of income to business, athletic, and entertainment “superstars” has increased income inequality.
2. In terms of demographics, large numbers of less-experienced and less-skilled “baby boomers” entered the labour force during the 1970s and 1980s, thus contributing to greater inequality during those decades. When high earnings potential men and women marry, the income to the highest quintile will likely increase. An increase in the number of families headed by single women has lead to greater inequality.
3. More international competition has reduced the demand for less-skilled, high-paid and often union workers in manufacturing industries in Canada. An upsurge in immigration of unskilled workers.
4. Two cautions: First, all quintiles have grown in terms of absolute income, but growth was fastest in the top quintile. Second, increased income inequality is not unique to the Canada
5. Global Perspective 16‑1 indicates that there is more inequality in other nations.
IV. Equality vs. Efficiency
A. The case for equality is based on the idea that more equal distribution will maximize utility. If income is subject to diminishing marginal utility, then people at the high end of the income scale receive less utility per dollar of income than people at the low end. The argument is that utility would be raised if low‑income people were given more by taking it from the high‑income groups. The high‑income earners would lose less utility than the low‑income groups would gain. This idea is illustrated in Figure 16-2, which assumes that money incomes are subject to diminishing marginal utility (Chapter 6). If this is true, utility would be maximized when each has the same amount of income dollars.
B. The case for inequality is that inequality is an important determinant of the amount of income produced and available for distribution overall. In other words, inequality provides an incentive for people to work harder and more efficiently.
C. The equality‑efficiency trade-off is the belief that society sacrifices some efficiency when it tries to achieve more egalitarianism. The “leaky‑bucket” analogy presumes that money must be transferred from the rich to the poor in a leaky bucket. The leak represents the efficiency loss due to the loss of incentives to work, to save and invest, and to accept risk. It also reflects the resources that must be diverted to bureaucracies that administer the tax‑transfer system. How much of a leakage is there? And how much should society accept? The answers to these questions are not clear. Studies about the extent of trade-off do not all agree, but the estimated loss ranges from a cost equal to the amount of the dollars given to the poor to as high as three times the amount of the dollars given to the poor.
V. The Economics of Poverty
A. The degree of income inequality will not predict the amount of poverty in a society.
B. Poverty is defined as a situation in which a family’s basic needs are greater than its means of satisfying them. The poverty‑level income is defined officially by government agencies based on family size
C. The poor are not homogeneous, nor are they randomly distributed. Table 16-3 provides details about the incidence of poverty among different groups in our society.
VI. The Income Maintenance System
A. The reduction in poverty is a widely accepted goal of public policy. Despite recent attempts to slow the upward trend in spending on these programs, enormous amounts of money are being spent.
B. The Canadian income-maintenance system consists to two kinds of programs: social insurance and public assistance. Both types are entitlement programs.
C. Public assistance programs provide benefits for those who are unable to earn income because of permanent handicaps or having no or very low incomes and also having dependent children.
VII. Welfare: Goals and Conflicts
A An ideal public assistance program would achieve three goals simultaneously:
1. The plan should be effective in getting individuals and families out of poverty.
2. It should provide adequate incentives for the able‑bodies to work.
3. Its cost should be reasonable.
4. Unfortunately, these three goals conflict, causing tradeoffs and necessitating compromises.
B. Common features: consider three hypothetical welfare plans.
1. In each of the three plans there is a minimum annual income that the government will provide.
2. Each plan has a benefit‑reduction rate that reduces benefits as income is earned.
C. Comparing the three plans on minimum annual income and benefit reduction rate, respectively: Plan 1 $8,000, 50%; Plan 2 $8,000, 25%; and Plan 3 $12,000, 50%.
D. Conflicts among goals:
1. Plan 1 keeps cost down but is not very effective in eliminating poverty and the high benefit reduction rate weakens work incentives.
2. Plan 2 has stronger work incentives, but is more costly and would pay benefits to more families.
3. Plan 3, when compared to Plan 1, is more effective in eliminating poverty, weakens work incentives, and is more costly because of the higher guaranteed income.
16-1 Using quintiles, briefly summarize the degree of income inequality in Canada. What criticisms have been made of standard data on income inequality? How and to what extent does government contribute to income equality?
The income share received by the highest 20 percent was 45.6 percent in 2000, which is almost ten times the 5.0 percent received by the lowest 20 percent. The middle three quintiles receive under 50 percent of the total before-tax income. The top two quintiles receive twice as much as the bottom three quintiles combined.
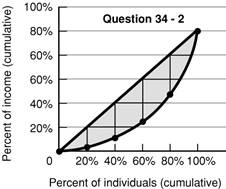
16-2 (Key Question) Assume Al, Beth, Carol, David, and Ed receive incomes of $500, $250, $125, $75, and $50 respectively. Construct and interpret a Lorenz curve for this five‑person economy. What percentage of total income is received by the richest and by the poorest quintiles?
See the figure below. In this simple economy each person represents a complete income quintile—20 percent of the total population. The richest quintile (Al) receives 50 percent of total income; the poorest quintile (Ed) receives 5 percent.
Question 16-2
16-8 Comment on or explain:
a. “To endow everyone with equal income will make for very unequal enjoyment and satisfaction.”
b. “Equality is a ‘superior good’; the richer we become, the more of it we can afford.”
c. “The mob goes in search of bread, and the means it employs is generally to wreck the bakeries.”
d. “Some freedoms may be more important in the long run than freedom from want on the part of every individual.”
e. “Capitalism and democracy are really a most improbable mixture. Maybe that is why they need each other—to put some rationality into equality and some humanity into efficiency.”
f. “The incentives created by the attempt to bring about a more equal distribution of income are in conflict with the incentives needed to generate increased income.”
(a) No distribution of income can ensure equal enjoyment. It can be argued that by equating incomes in a society we maximize the probability of maximizing total utility for all individuals.
(b) The lessening of poverty provides a host of indirect benefits to affluent members of society—social peace, physical security, and perhaps the intangible satisfaction of living in a more equitable society. The better off the affluent become, the more they are willing to spend in order to purchase these benefits.
(c) Mobs commonly exhibit a marked preference for present over future consumption. Many conservatives contend that the income redistribution schemes resulting from democratic decision-making suffer from a similar failing in that they decrease the incentive to accumulate capital in order to provide present consumption to the poor. Is this view valid? Perhaps. Does this mean that such redistribution schemes are misguided? Not necessarily.
(d) This is a common conservative view, that civil and political liberties are more important than the universal eradication of poverty. Liberals are likely to contend that ensuring universal freedom from want does not necessarily detract from these fundamental freedoms.
(e) The principles underlying the two systems can be summarized as follows: Each dollar has a vote in the marketplace, and each person has a vote at the ballot box. These principles are similar enough that the presence of one often leads to the other. They are dissimilar enough that the type of society that arises from a combination of the two represents a workable social compromise.
(f) Incentives created in the attempt to bring about more equal distribution of income may cause a trade-off in decreased economic efficiency. Higher marginal taxes may reduce the efforts of those at the top to work harder and produce more. Greater benefits to those at the bottom may reduce their incentive to do the same as they receive benefits without the productive effort. Insofar as this trade-off occurs, there will be a reduction in economic growth and, therefore, damage to incentives leading to increased incomes.
16-9 (Key Question) The table shown below contains three hypothetical public assistance plans.
|
|
|
|
|
||||||||||||||||||
Plan One |
|
Plan Two |
Plan Three |
|
|
|||||||||||||||||
Earned |
NIT |
Total |
Earned |
NIT |
Total |
Earned |
NIT |
Total |
||||||||||||||
|
|
|
|
|
|
|
|
|
||||||||||||||
|
|
|
|
|
|
|
|
|
||||||||||||||
$ 0 |
$4,000 |
$4,000 |
$ 0 |
$4,000 |
$ 4,000 |
$ 0 |
$8,000 |
$ 8,000 |
||||||||||||||
|
|
|
|
|
|
|
|
|
||||||||||||||
a. Determine the basic benefit, the benefit reduction rate, and the break‑even income for each plan.
b. Which plan is the most costly? The least costly? Which plan is most effective in reducing poverty? The least effective? Which plan embodies the strongest disincentive to work? The weakest disincentive to work?
c. Use your answers in part (b) to explain the following statement: “The dilemma of the negative income tax is that you cannot bring families up to the poverty level and simultaneously preserve work incentives and minimize program costs.”
(a) Plan 1: Minimum income = $4,000; benefit reduction rate = 50 percent; break-even income = $8,000 (= $4,000/.5). Plan 2: Minimum income = $4,000; benefit reduction rate = 25 percent; break-even income = $16,000 (= $4,000/.25). Plan 3: Minimum income = $8,000; benefit reduction rate = 50 percent; break-even income = $16,000 (= $8,000/.5).
(b) Plan 3 is the most costly. Plan 1 is the least costly. Plan 3 is most effective in reducing poverty (although it has a higher benefit reduction rate than Plan 2, its minimum income is higher). Plan 1 is least effective in reducing poverty. Plan 3 has the strongest disincentive to work (although it has the same benefit reduction rate as Plan 1, its higher minimum income discourages work more). Plan 2 has the weakest disincentives to work (its minimum income and benefit reduction rates are low).
(c) The only way to eliminate poverty is to provide a minimum income high enough to lift everyone from poverty, including people who cannot work or choose not to work. But this large minimum income reduces the incentive to work, expands the number of people receiving transfer payments, and substantially boosts overall program costs.
16-10 (Key Question) The labour demand and supply data in the next table relate to a single occupation. Use them to answer the questions that follow. Base your answers on the taste-for-discrimination model.
|
|
|
|
Quantity of |
Visible minority |
Quantity of |
|
|
|
|
|
|
|
|
|
24 |
$16 |
|
52 |
|
|
|
|
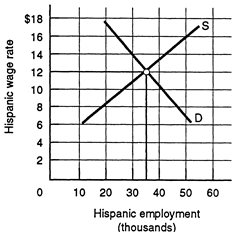
a. Plot the labour demand and supply curves for visible minority workers in this occupation.
b. What are the equilibrium visible minority wage rate and quantity of visible minority employment?
c. Suppose the white wage rate in this occupation is $16. What is the visible minority-to-white wage ratio?
d. Suppose a particular employer has a discrimination coefficient d of $5 per hour. Will that employer hire visible minority or white workers at the visible minority–white wage ratio indicated by part (c)? Explain.
e. Suppose employers as a group become less prejudiced against visible minorities and demand 14 more units of visible minority labour at each visible minority wage rate in the table. What are the new equilibrium visible minority wage rate and level of visible minority employment? Does the visible minority–white wage ratio rise or fall? Explain.
f. Suppose visible minorities as a group increase their labour services in this occupation, collectively offering 14 more units of labour at each visible minority wage rate. Disregarding the changes indicated in part (e), what are the new equilibrium visible minority wage rate and level of visible minority employment? Does the visible minority–white wage ratio rise, or does it fall?
(a) See the graph.
(b) The equilibrium visible minority wage rate is $12; the equilibrium quantity of visible minority employment is 36,000 workers.
Visible minority
employment (thousands)
16-11 Males under the age of 25 must pay far higher auto insurance premiums than females in this age group. How does this fact relate to statistical discrimination? Statistical discrimination implies that discrimination can persist indefinitely, while the taste-for-discrimination model suggests that competition might reduce discrimination in the long run. Explain the difference.
Statistical discrimination occurs when people are judged on the basis of the average characteristics of the group to which they belong. Insurance companies base auto insurance premiums on the statistical information available, and the consequent discrimination will continue as long as there is a difference in accident rates by gender in this age group.
The taste-for-discrimination model suggests that competition will reduce discrimination in the long run. Firms that do not discriminate will have lower actual wage costs per unit of output and lower average total costs than will the firms that discriminate. These lower costs will allow non-discriminating firms to charge lower prices. This should eventually drive the discriminating firms out of the market.
16-12 (Key Question) Use a demand and supply model to explain the impact of occupational segregation or “crowding” on the relative wage rates and earnings of men and women. Who gains and who loses from the eliminationof occupational segregation? Is there a net gain or net loss to society? Explain.
See Figure 16-5. Discrimination against women in two of the three occupations will crowd women into the third occupation. Labour supply in the “men’s occupations” (X and Y) decreases, making them high-wage occupations. Labour supply in the “women’s occupation” (Z) increases creating a low-wage occupation.
Eliminating occupational segregation would entice women into the high-wage occupations, increasing labour supply there and reducing it in the low-wage occupation. The wage rates in the three occupations would converge to B. Women would gain, men would lose. Society would gain because the increase in output in the expanding occupations would exceed the loss of output in the contracting occupation.
16-13 “Current employment equity programs are based on the belief that to overcome discrimination, we must practice discrimination. That perverse logic has created a system that undermines the fundamental values it was intended to protect.” Do you agree? Why or why not?
Supporters of affirmative action argue that job discrimination is so pervasive that it will persist for decades unless preferential treatment is extended to job applicants who are members of the groups subject to past discrimination. Critics say that quotas and preferential treatment are a form of reverse discrimination. To show preference for A is to discriminate against B.
The nature of a market economy includes competition for the best jobs. Government cannot possibly insure equal outcomes for all individuals in the economy. Attempting to do so would require a degree of government control that would approach central planning and destroy important incentives that promote productivity. A better course of action would be to improve opportunities for disadvantaged groups by supporting additional education and training to level the playing field. While government cannot insure equal outcome, it can contribute greatly to equal opportunity.
16-14 Suppose Ann and Becky are applicants to your university and that they have identical admission qualifications (high school GPA, etc.). Ann is a member of a vivible minority, growing up in a public housing development; Becky is white, growing up in a wealthy suburb. You can admit only one of the two. Which person would you admit and why? Now suppose that Annis white and Beckyis a member of a visible minority, all else equal. Does this change your selection? Why or why not?
The real issue in this question is not the color of the applicant, but the advantages or disadvantages the students have had during their high school preparation. If the two applicants are equal in other respects, the student growing up in a public housing development should be selected, rather than the student from the wealthy suburb.
16-15 (The Last Word)How do poor people describe “well-being” and “ill-being”?
Well being was described by the following: happiness, harmony, peace, freedom from anxiety, and peace of mind. “Ill-being” was described as lack of material things, as bad experiences, and as bad feelings about oneself.
Consider This
What two types of discrimination are represented by the discrimination evidenced in this chapter’s Last Word?
The two models of discrimination discussed were taste-for-discrimination and statistical discrimination. Economists Claudia Goldin and Cecilia Rouse examined evidence of discrimination in the hiring of musicians for major symphony orchestras. If the past discrimination in hiring was an example of statistical discrimination, they would expect to observe a higher turnover rate among women. Since this proved not to be the case, the evidence suggests that male musical directors have a taste for discrimination.
Source: http://highered.mheducation.com/sites/dl/free/0070916578/124522/mc_im16.DOC
Web site to visit: http://highered.mheducation.com
Author of the text: indicated on the source document of the above text
If you are the author of the text above and you not agree to share your knowledge for teaching, research, scholarship (for fair use as indicated in the United States copyrigh low) please send us an e-mail and we will remove your text quickly. Fair use is a limitation and exception to the exclusive right granted by copyright law to the author of a creative work. In United States copyright law, fair use is a doctrine that permits limited use of copyrighted material without acquiring permission from the rights holders. Examples of fair use include commentary, search engines, criticism, news reporting, research, teaching, library archiving and scholarship. It provides for the legal, unlicensed citation or incorporation of copyrighted material in another author's work under a four-factor balancing test. (source: http://en.wikipedia.org/wiki/Fair_use)
The information of medicine and health contained in the site are of a general nature and purpose which is purely informative and for this reason may not replace in any case, the council of a doctor or a qualified entity legally to the profession.
The following texts are the property of their respective authors and we thank them for giving us the opportunity to share for free to students, teachers and users of the Web their texts will used only for illustrative educational and scientific purposes only.
All the information in our site are given for nonprofit educational purposes
The information of medicine and health contained in the site are of a general nature and purpose which is purely informative and for this reason may not replace in any case, the council of a doctor or a qualified entity legally to the profession.
www.riassuntini.com