CHAPTER 7
PROCESS-FLOW ANALYSIS
Teaching Notes
This chapter deals with analyzing and improving process flows including the flows of customers in service operations, material flows and information flows. This chapter is somewhat unique in operations textbooks, since process flow analysis is often mentioned but not given extensive treatment. Nevertheless, process flow analysis is one of the most fundamental ways to improve the efficiency and effectiveness of most operations.
In teaching this chapter, I emphasize the basic ideas of systems thinking and tracing process flows through the use of flow-process charts. This is supplemented by process measurements such as capacity, throughput, flow rate, inventory, bottlenecks and Little’s Law. I also emphasize the notion that material flows and information flows should both be analyzed together in most operations. A section on Service Blueprinting is included and finally applications of the principles of process-flow analysis in Business Process Reengineering (BPR) are discussed. For further discussion of BPR, the books by Hammer and Champy (2001), and Hammer (1996) can be used as references. The Godfrey and Bandy (2004) article on Little’s Law and the Theory of Constraints is also useful.
Answers to Questions
1. a. Colleges provide a multitude of services. Probably the central service of a college is providing information, through courses, to the students. Primary process flows would then include: information flows, student flows and instructor flows. Suppliers provide facilities, food and utilities.
b. A fast food restaurant provides good food, quickly and in pleasant surroundings. Primary process flows include the material flow of food within each restaurant and the information flow for control of the franchises by the corporate headquarters. Customers are the general public and suppliers provide food and support services.
c. A library provides free and convenient access to books, records, magazines, the Internet, etc. Primary process flows include acquiring, cataloging, storing, issuing, and monitoring the loans of this material and providing access to the Internet. Suppliers provide books, software and electronic references.
2. The process view allows an organization to analyze the sequence of processes or steps used in converting inputs into outputs. Since the processes cut across different functional departments, the process view emphasizes the cross-functional nature of decision making. It also illustrates that functions must make a hand-off from one another in executing the processes and allow greater coordination.
3. Little’s Law says the average number of items in a system is the product of the average flow rate into the system and average length of time an item spends in the system.
Little’s Law can be used to calculate the inventory that will accumulate in a system or the number of people that will be waiting in line for a given flow rate and throughput time. It can also be used to calculate the flow rate or throughput time when the other two variables are known.
Little’s Law applies when the system is in steady state where the average input rate equals the average output rate. It also only applies to averages of the variables. It does not provide an estimate of the variance that might be found in the three variables.
4. A bottleneck is a resource that limits the capacity of the entire system. The bottleneck is found by taking minimum of the capacity of all the resources required in the process. The resource with the minimum capacity is called the bottleneck.
It is important to find the bottleneck, since it limits the capacity of the entire system. Additional output from the bottleneck will provide more output from the system provided demand and supply are not constraining the system.
5. The flow rate of a system cannot be more than the minimum of capacity, demand and supply. Increasing capacity will improve the flow rate only if there is sufficient demand and supply. Likewise, increasing demand will only result in a higher flow rate if there is sufficient capacity. These three quantities are interrelated.
6. Different forms or symbols may be used for analyzing information, material or service flows. Certainly different types of flows are being charted. However, the purpose is the same to improve the efficiency and effectiveness of operations. Also the same steps must be taken and the same types of questions asked during the analysis.
7. a. If materials flow is analyzed alone, management control of the new process may be insufficient or lacking.
b. If control information is analyzed alone, materials flow may still be inefficient or ineffective.
c. Improvement of both information and materials flows results in synergistic effects between the two flows.
8. Primarily the problem of convincing people to change or abandon their current procedures which are implementation problems.
9. Radical improvement and continuous improvement of processes can each be the best approach depending upon the state of the existing process and the kind of process desired. Both approaches may also be implemented to complement each other.
Radical improvement is preferred when the business processes are antiquated and need to be fully redesigned. Whereas, continuous improvement will be more applicable when improvement in small steps can lead to more efficient and effective operations and when radical process redesign will lead to rejection or other serious social concerns on the part of the people involved in the process.
10. a. To identify the components of the system that will be affected by improvements.
b. To determine better answers to the questions of what, who, where, when and how in analyzing the process for improvement since these questions pertain not only to process but also the other components of the system.
c. To be able to determine the possible socio-technical impact of improvements.
d. To come up with improvements that are both economically and humanly rewarding and that will gain the acceptance of the people concerned.
11. Answers will vary depending upon the student’s sources.
12. Information obtained will vary depending upon the company visited.
13. Students will use their own words to describe the service blueprint concept. A typical statement is, “service blueprinting is a flow chart that describes the steps in the process for providing the service to the customer. Each interaction between the customer and service provider is shown in the blueprint.”
14. The service blueprint includes a line of visibility that separates all interactions between the customer and the back room, whereas in manufacturing we can separate production from consumption and thus the customer is not part of the process. Also, each point of interaction with the customer is shown on the service blueprint. But, manufacturing flowcharts do not show these points of interaction since the customer is outside the system. Information systems flow charts may also suffer from not demonstrating each point of interaction with the customer.
Answers to Problems
1. a. Using Little’s Law: I = T X R, I = 6 X 10 = 60, There are 60 claims in the system on average.
b. Flow rate = minimum (capacity, demand, supply) = minimum (8, 7) = 7 claims per hour. This answer assumes supply of claims is at least 7 per hour.
c. We have assumed that the system is in steady state, that is the average flow rate into the system equals the average flow rate out. The answers only provide averages.
2. a. The capacity of the system = minimum (1000, 800, 1200) = 800 checks per hour.
b. Using Little’s Law solve for T: T = I/R = 200/600 = .333 hours = 20 minutes.
c. The throughput time can be decreased by either decreasing I, the number of checks in the system, or increasing R, the flow rate.
3. a. The capacity of the receptionist is 4 minutes per customer or 15 customers per hour.
The capacity of each stylist is 25 minutes per customer or 60/25 customers per hour. There are three stylists providing a total capacity of 3(60/25) = 7.2 customers per hour. The capacity of the process is 7.2 customers per hour and the stylists are the bottleneck.
b. The average throughput time is 1 + 25 + 3 = 29 minutes. The average number of customers in the system is I = T X R = 29/60 X 5 = 2.42 customers
c. If the input to the system is random, as the flow rate approaches the capacity of the system, the number of customers waiting will approach a very large number (infinity). This occurs because capacity is wasted whenever the number of customers arriving in a given time interval is less than capacity and when the arrivals later exceed capacity the lost capacity cannot be recovered.
4. a. The capacity of each resource is as follows:
Judy’s assistant takes 7 minutes per customer total and can handle 60/7 = 8.57 customers per hour.
Judy takes 8 minutes per order and can handle 60/8 = 7.5 cakes per hour
Each oven takes 30 minutes per order and can handle 2 orders per hour. There are 3 ovens so the total oven capacity is 6 cakes per hour.
The capacity of the process is 6 cakes per hour and the bottleneck is the ovens.
b. Throughput time = 2 + 8 + 30 + 60 + 2 + 3 = 105 minutes
c. I = T X R = 105/60 X 5 = 8.75 cakes in inventory
5. In this problem the kitchen and the bar operate in parallel, so this is considered below.
a. The capacity of each resource is as follows:
The service manager takes 2 minutes per order and can handle 30 orders per hour
Each chef takes 16 minutes and can handle 60/16 = 3.75 orders per hour. There are 4 chefs so the kitchen can handle 4 X 3.75 = 15 orders per hour.
The Bartender takes 3 minutes and can handle 20 orders per hour.
Each waiter takes 20 minutes and can handle 3 orders per hour. There are 6 waiters so they can handle a total of 18 orders per hour.
The minimum capacity of these resources is the kitchen that can handle 15 orders per hour, so the kitchen is the bottleneck. Note: the bartender operates in parallel with the kitchen and has more capacity (at 20 orders per hour) than the kitchen, even without considering that only 80% of the orders require bar service. So, the bar is not a constraint.
b. Throughput time = 2 + 16 + 20 = 38 minutes.
Note, the bartender time is not added, since bar service is provide in parallel.
c. I = T X R = 10 X 38/60 = 6.33 orders in the system on average
d. The total labor costs are as follows:
Waiters 6 x 6 = 36
Cooks 10 x 4 = 40
Bartender 1 x 7 = 7
Manager 1 x 12 = 12
Total Labor 95
The overhead is added 95 + 95 x .60 = 152
The labor cost including overhead per order is then $15.20 per order at 10 orders per hour
The food and beverage cost of $6 per order is added for a total of 15.20 + 6.00 = $21.20 average cost per order.
The minimum cost per order is achieved when the system is operating at capacity (15 orders per hour).
The labor cost per order is 152/15 = 10.13. Adding the food cost the total cost is $16.13 average cost per order.
11. Preparing yourself for a job interview:
What: Arrive at interview, appearing presentable, with the proper articles. Leave home in proper condition.
Who: Myself.
When: On time.
How: Cleaning up is best done at home in private. Reading the newspaper could be done on the bus. Gathering briefcase could be done the night before. You could also make the bed when you first get up, saving the trip back to your room to make the bed.
Going to the library to study and returning to your room:
What: To study at the library.
Who: Myself
When: To reach the library at the shortest possible time and be able to finish studying before the time that I need to do other things.
How: Always put items in their designated places so that it is easy to locate the materials to bring to the library for studying. Know the schedule of the bus so that time spent waiting for the bus can be minimized.
12 a. Service Blueprint for Pizza delivery
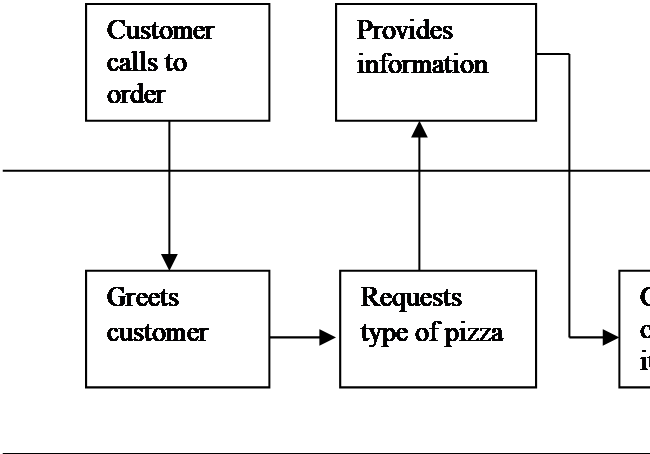
Kitchen
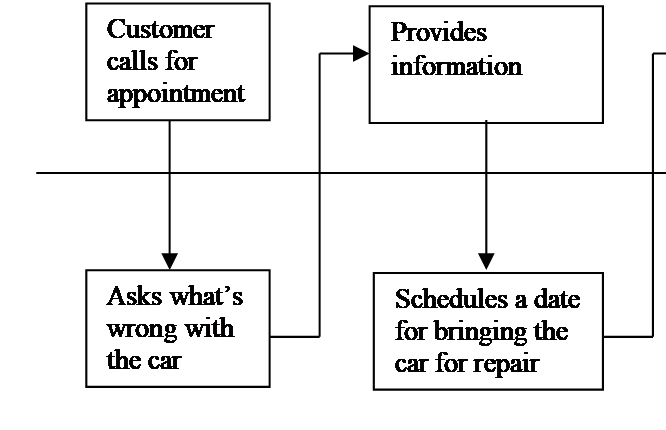
12 b. Service Blueprint for Automobile repair
What: Customers need fast delivery, a complete order, and a quality product. If the sales person is trained to be a better listener to customer’s orders, this might improve operations. Also if the delivery person has more experience in driving that will improve timeliness of the delivery. The product itself might be improved by changing ingredients or the training of the kitchen employees.
Who: Most of the service providers are relatively unskilled. But, training can help improve the system to a great degree.
Where: This question deals with arrangement of products and supplies in the kitchen and the location of the pizza store. There may be many opportunities for improvement in the layout of the kitchen or even the location of the store.
When: Reconsider the existing processes in order to optimize them and to speed up the pizza preparation and delivery.
How: If possible the Pizza Delivery Company might think of including online order taking for its customers. Also, the delivery person might be equipped with a special navigating technology that provides help in locating the addresses and optimizing the route between several addresses.
b) Automobile Repair
What: Customers need timely repair at a reasonable price. Assure customers that the repair will be rapidly completed thereby saving the time of the customer and employees.
Who: Perhaps the customer service representative could diagnose the problem and thus save time for the service manager.
Where: The Car Repair Company might wish to reconsider the way spare parts are ordered, delivered, and stored in the facility.
When: In order to speed up the process of repair, different technicians might be trained (specialized) to complete different repairs and thus speed up the process. Determine if standard procedures can be defined for repair to save time during maintenance.
How: Technology might be used to make a better diagnosis of the car and to complete the repair.
Source: http://novellaqalive2.mhhe.com/sites/dl/free/0073137065/302141/IM_Chapter_07.doc
Web site to visit: http://novellaqalive2.mhhe.com
Author of the text: indicated on the source document of the above text
If you are the author of the text above and you not agree to share your knowledge for teaching, research, scholarship (for fair use as indicated in the United States copyrigh low) please send us an e-mail and we will remove your text quickly. Fair use is a limitation and exception to the exclusive right granted by copyright law to the author of a creative work. In United States copyright law, fair use is a doctrine that permits limited use of copyrighted material without acquiring permission from the rights holders. Examples of fair use include commentary, search engines, criticism, news reporting, research, teaching, library archiving and scholarship. It provides for the legal, unlicensed citation or incorporation of copyrighted material in another author's work under a four-factor balancing test. (source: http://en.wikipedia.org/wiki/Fair_use)
The information of medicine and health contained in the site are of a general nature and purpose which is purely informative and for this reason may not replace in any case, the council of a doctor or a qualified entity legally to the profession.
The following texts are the property of their respective authors and we thank them for giving us the opportunity to share for free to students, teachers and users of the Web their texts will used only for illustrative educational and scientific purposes only.
All the information in our site are given for nonprofit educational purposes
The information of medicine and health contained in the site are of a general nature and purpose which is purely informative and for this reason may not replace in any case, the council of a doctor or a qualified entity legally to the profession.
www.riassuntini.com